

What are Candle Sticks on trading platforms? What does Green or Red mean?
- JBINZALA

- Aug 17, 2024
- 2 min read
In the world of trading, understanding candlesticks is key to deciphering valuable insights from price movements. Candlesticks are graphical representations of price movements in a specific time frame, providing traders with crucial information about market sentiment. Whether you're new to stock trading or dipping your toes into the world of crypto trading, comprehending candlesticks can significantly enhance your trading strategies.
The Basics of Candlesticks
Candlesticks consist of four main price points: open, close, high, and low. Each candlestick visually displays these price points, helping traders analyze the price action during a specific period. The body of the candlestick represents the price range between the opening and closing prices, while the upper and lower wicks show the highest and lowest prices reached during the timeframe.
Open Price
The open price is represented by the small horizontal line on the left side of the candlestick, indicating the first traded price when the time period starts.
Close Price
Conversely, the close price is depicted by the small horizontal line on the right side of the candlestick, signifying the last traded price when the time period ends.
High and Low Prices
The upper and lower wicks, or shadows, extend from the body of the candlestick, illustrating the highest and lowest prices reached during the specified timeframe.
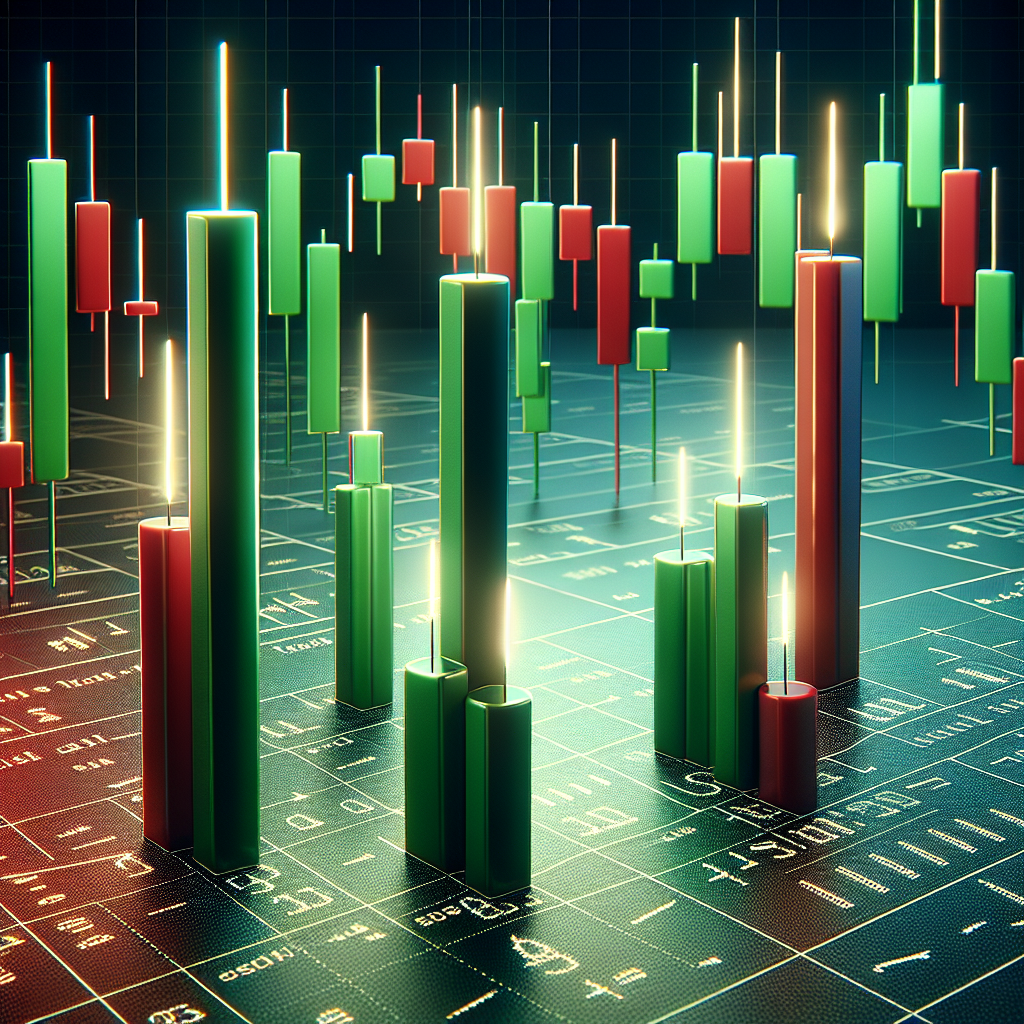
Interpreting Green and Red Candlesticks
When examining candlesticks, you'll often come across two distinct colors: green and red.
Green Candlesticks
Green candlesticks typically indicate that the closing price is higher than the opening price, reflecting a bullish sentiment. In simple terms, green candlesticks suggest that the asset's price increased during the timeframe represented by the candlestick.
Red Candlesticks
Conversely, red candlesticks suggest a bearish sentiment, as the closing price is lower than the opening price. A red candlestick signifies that the asset's price decreased over the specified period.

Leveraging Candlesticks in Trading
Understanding candlesticks is essential for traders as they provide valuable insights into market dynamics. By analyzing candlestick patterns and formations, traders can make informed decisions regarding when to enter or exit trades, as well as predict potential price movements.
Common Candlestick Patterns
Doji: Indicates market indecision and potential reversals.
Hammer: Suggests a potential bullish reversal.
Shooting Star: Signals a potential bearish reversal.
In Conclusion
Candlesticks are powerful tools that empower traders to glean insights into market trends and sentiment. By mastering the art of reading candlesticks, traders can enhance their trading strategies and make informed decisions based on price movements. Whether you're delving into stock trading or venturing into crypto markets, understanding candlesticks is a fundamental step towards achieving trading success. Next time you're analyzing price charts on a trading platform, remember to pay attention to the tales told by the humble yet insightful candlesticks!


![Bitcoin: A Peer-to-Peer Electronic Cash System by Satoshi Nakamoto [2008]](https://static.wixstatic.com/media/5aa5e5_37885f7a0fad4c15a4022310273a2acd~mv2.webp/v1/fill/w_980,h_551,al_c,q_85,usm_0.66_1.00_0.01,enc_avif,quality_auto/5aa5e5_37885f7a0fad4c15a4022310273a2acd~mv2.webp)
Comments